
Project Description
For this analysis, I selected data from archaeological finds discovered during the reconstruction of Moscow’s streets. The data includes:
— Distribution of finds by year — Type of finds (coins, vials, pitchers, etc.) — Distribution of finds by the «My Street» program — Distribution of finds by geographical coordinates (latitude, longitude) — Distribution of finds by dating
Diagram 1 Distribution of Findings by Year
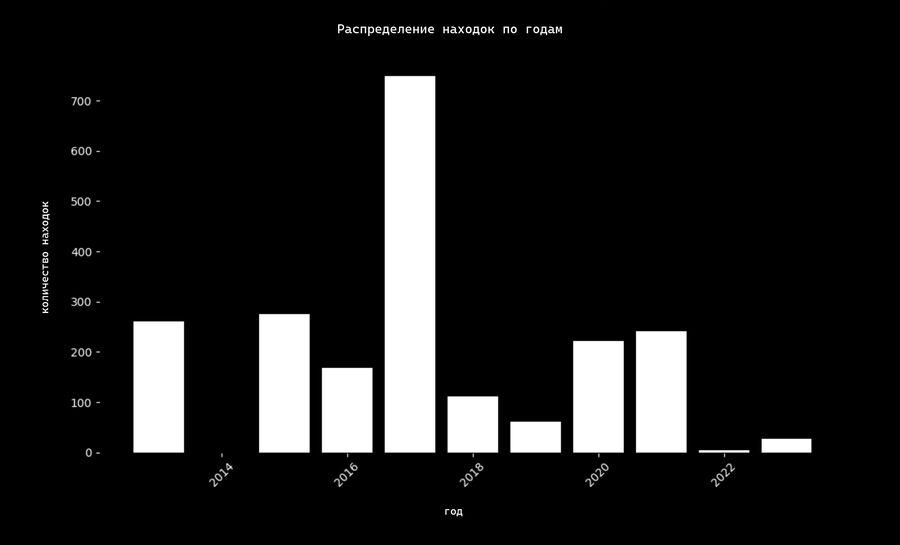
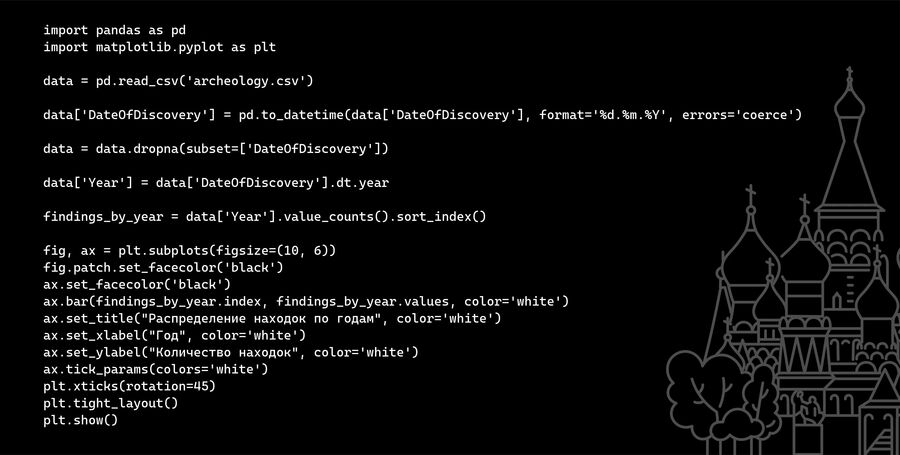
Diagram 2 Distribution of Finding Types
Diagram 3 Distribution of Findings by the «My Street» Program
Diagram 4 Distribution of Finds by Geographic Coordinates
Diagram 5 Distribution of Findings by Dating
(Dating information has been removed)
While analyzing the dataset detailing archaeological finds made during the reconstruction of Moscow’s streets, I developed five diagrams that visually illustrate the relationship between the types and quantities of finds and various factors.
According to the chart data, the most frequent findings were: 1) Year of discovery: 2018–2020 2) Type of find: coins 3) Program: «My Street» 4) Location: central districts of Moscow 5) Dating: 17th–18th century