Introduction
For visualization, a well-known dataset was chosen, which contains hotel reservation information collected by Nuno Antonio, Ana Almeida, and Luis Nunes.
Attach card
These data were particularly interesting to me because my parents work in this industry, and the conclusions that can be drawn from them allow for the more optimal organization of operational processes within a hotel.
Project Stages:
- Dataset Selection
- Data Analysis
- Visualization
Chart View
- Line Chart
- Bar Graphs
The line chart was used to visualize booking trends from month to month. Bar graphs are very useful for comparing various data categories. In this study, they were employed to examine cancellation patterns across different segments.
Data Processing
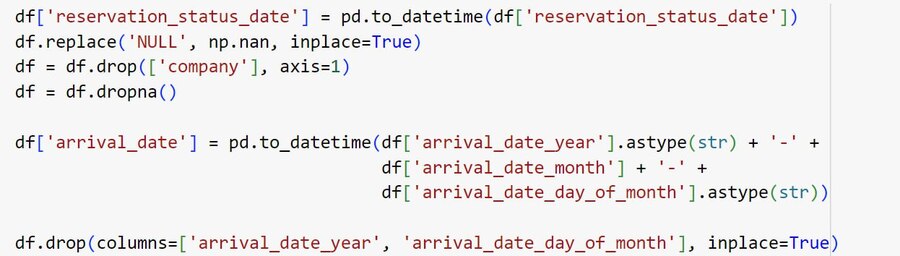
The date column was converted to the datetime type; it was originally a string type. df['reservation_status_date'] = pd.to_datetime (df['reservation_status_date'])
Missing values were removed df.replace ('NULL', np.nan, inplace=True) df = df.drop (['company'], axis=1) df = df.dropna ()
Disparate booking date columns were consolidated into one
Final Timelines
Schedule 1
Chart 1 allows tracking booking surges from month to month, and year to year. The information gathered can be used to adjust pricing policies or define periods based on shifts in demand.
Schedule 2
Chart 2 illustrates the time elapsed from the booking moment to hotel check-in, alongside the number of booking cancellations. This information can be used to revise the cancellation policy (we can see that most bookings made more than 300 days in advance were canceled).
Schedule 3
Graph 3—the constructed graph—provides insight into the months when reservations were canceled most frequently. It can also be used to adjust policies related to cancellation fees for specific months.
Schedule 4
Schedule 4 provides an overview of the number of cancellations (we see approximately 30%). This allows for a more precise estimation of the cash flow expected from each booking.
Additional Information
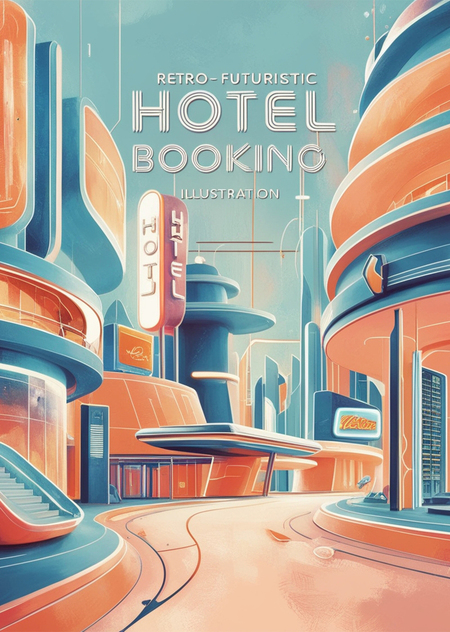
Leonardo.ai was used to create the cover. Prompt: hotel booking demand (blue and orange pastel colours)
Notebook and Dataset: https://drive.google.com/drive/folders/1_jnAMrBoB08iVPeDIQNhkOypPjLqRjCy?usp=share_link
link to the project reflecting the new criteria
https://colab.research.google.com/drive/19vVsvixZJqQG3jYy9dJ0YLs0O9lFdZDm?usp=sharing